Project Repo: https://github.com/sksamra/miRNA_overlap_between_AD_PD
In this project, we identified 13 miRNAs that were shared between the diseases and between the biofluids. Among the proteins that relate to these miRNAs, five of them are common to both Alzheimer's disease (AD) and Parkinson's disease (PD) but have not been identified yet in pre-existing studies. We hope that these significant proteins that we found as genetically overlapped in the cerebrospinal and serum biofluid regions will help future researchers and scientists to gain a better understanding at how these two diseases are linked and that future progress in treatment of AD and PD can be made in order to target these proteins.
Navigation Menu
Project Goal
Our research goal is to compare overlapping patterns in differentially expressed miRNA between Alzheimer’s disease (AD) and Parkinson’s disease (PD) and be able to pinpoint any important genes that they share (and the subsequent proteins those genes encode). Future researchers can then leverage this information to identify the affected biological pathways in order to better understand the disorders, and potentially help to predict and prevent them.
Previous studies have attempted to investigate PD and AD using miRNA. Kasandra et al. profiled the miRNA from over 200 samples that are from both PD/AD patients and healthy subjects, but they mainly emphasized the differences between the miRNAs of PD and those of AD instead of the overlap [1]. Hewel et al. discussed the common miRNA between AD and PD, but their area of interest was the human gut metagenome [2]. Although they found a set of miRNAs that overlapped, the result may be restricted to only the gene expression for the regulation of the microbiome, instead of the cell-based pathological changes in brain tissue. Therefore, our investigation can potentially reveal the hidden link between PD and AD.
Background
This study aims to find gene expression similarities and differences between patients of Alzheimer’s (AD) and Parkinson’s (PD). The study uses sequencing data from microRNA (miRNA) found in two of the body’s biofluids: cerebrospinal fluid (CSF) and blood serum (SER). Although these disorders are experienced by many people, little is known about what specifically causes the two diseases and how to prevent or cure them. The difficulty in finding these solutions arises from the complexity of the “pathomechanisms” underlying the diseases, as well as their tendencies to have early stages that are asymptomatic, making detection very challenging until symptoms set in [1].
With our analysis, we aim to study the genetic causes underlying the two diseases by inspecting the sequencing data found in patients’ bodies in the form of miRNA sequences. Uncovering the genetics behind the diseases can help researchers better their understanding of the development of AD and PD in humans and improve their chances of finding efficient preventative measures for the two disorders. Furthermore, the similarities that we may find between the disorders can aid in the research of neural disorders in general, and contribute to early diagnosis, prevention, and cures.
Psychiatric Disorders
Alzheimer's
Alzheimer's disease is a progressive brain disorder that heavily impacts brain function in that it slowly deteriorates memory and thinking skills, leading to symptoms like forgetting recent events or conversations, to eventually losing the ability to carry out simple tasks or even recognize friends and family members. Difficulty in reasoning and thinking is also a common symptom, especially with abstract concepts like numbers, again making everyday tasks like paying bills challenging. AD also impairs people's abilities to make decisions in everyday situations, like driving. The principal risk factor of Alzheimer's is age; people become more likely to to develop AD as they grow older. Family history can also increase a person's chances of developing the disease. A genetic link to increased chance of AD shows in the form of a variation of the gene APOE e4, something we will definitely explore further in our study. As of now, there is no known cure for AD, but medications have been known to improve or slow the effect of the disease, and programs and caregivers help to support AD patients. [3]Parkinson's
Parkinson's disease is a progress nervous system disorder that impacts movement. There are a myriad of symptoms that constitute PD, including a tremor (trembling) in a limb like a hand or fingers, slowed movement, rigid muscles, and impaired posture and balance. PD is also sometimes accompanied by other complications, like cognitive issues (trouble thinking, dementia), emotional changes (like depression), swallowing, chewing, and eating problems, among others. The principal risk factor of PD is age; PD usually develops in people age 60 or older. Other risk factors include family history and sex (men are more likely to develop it than women). As of now, there are no known cures or even prevention methods for Parkinson's. However, there are medications that can ease the symptoms, as well as surgeries that can regulate parts of the brain to improve symptoms. [4]miRNA
Our sequence data comes from the encodings of microRNA strands. microRNA (miRNA) are a class of non-coding RNAs that regulate gene expression. Specifically, they bind to specific mRNA and prevent those target mRNA from translating the necessary directions to produce certain proteins. Because of the behavior of miRNA, it will be worthwhile to explore which miRNA are binding to which mRNA, and subsequently what proteins are being down-regulated (lowly expressed). These proteins could then be contributing factors to the symptoms and/or development of the two diseases [5].
CSF/Serum
The miRNA in our study was sourced from two locations (specifically, fluids found in our body): cerebrospinal fluid (CSF) and blood serum (SER). These two fluids are part of the central nervous system, which are highly impacted by both PD and AD. CSF cushions the brain and is a "shock absorber" for the central nervous system, and also removes waste products from the brain [6]. miRNAs can be found in the CSF and have been found to be instrumental in responding to malignant tumors in the nervous system [7]. Blood serum (or serum) is the fluid that blood cells move through, but without the plasma - it is the clear liquid that remains after blood clots [8]. miRNA is found in serum as "secreted miRNAs", meaning miRNA that has been excreted from cells or tissues [9].
EDA
Experiments Features Table
Our data comes from a pre-existing dataset which has 345 samples from patients with Alzheimer’s and Parkinson’s as well as the control group, which is perfect for the purposes of our study (Adler et. al, 5 May 2014). The dataset includes 69 patients with Alzheimer’s disease, 67 with Parkinson’s disease and 78 healthy controls, in two different biofluid regions: cerebrospinal fluid (from brain ventricle structure) and serum (from the entire cardiovascular system). These regions are associated as being “deregulated in brain tissue from patients with neurodegenerative disease” and thus are useful when examining these diseases (Adler et. al, 5 May 2014)
Here are the features we used in out analysis from the data:
| Feature | Description |
|---|---|
| CONDITION | The disease that each patient was afflicted by (Alzheimer’s or Parkinson’s), or if the patient was part of the control group (healthy) |
| BIOFLUID | The source of the sample from the patient’s body (CSF or serum) |
| sex | Gender of the subject |
| expired_age | Age of the subject at death |
| PMI | Post-mortem interval, which means the amount of time between the subject’s death and when the sample was collected from the body of the subject. |
| PlaqueTotal | Total amount of plaques [10]. |
| TangleTotal | Total amount of tangles [10]. |
| Braak score [11] | A score that is used to measure the degree of brain disfunction for both Alzheimer’s and Parkinson’s patients. |
| LB Stage [12] | The stage of lewy body dementia, which is often related to Parkinson’s disease. |
| sn_depigmentation [13] | Substantia nigra depigmentation. |
| NIA_R [14] | A postmortem diagnosis of Alzheimer’s disease |
By inspecting these features, specifically performing EDA and doing research on what each of the values mean, we can delve further into the analysis by determining what features will be important in the differential gene analysis model, and which of them will significantly differentiate between Alzheimer’s, Parkinson’s and healthy patients in terms of their genetics.
The figures below show the sample count distribution of each “disease marker” mentioned above.
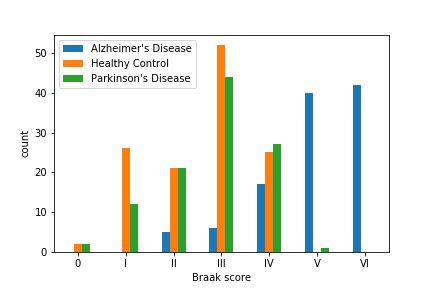
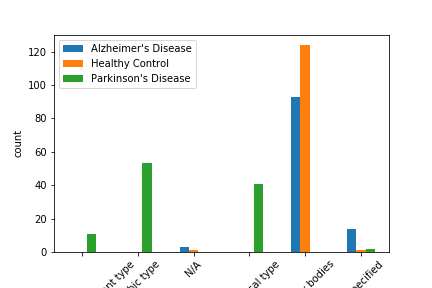
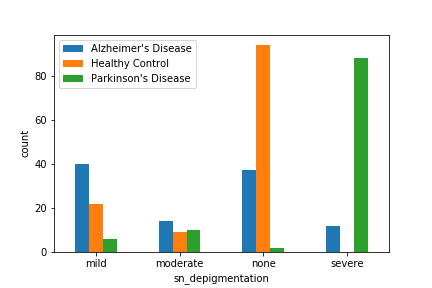
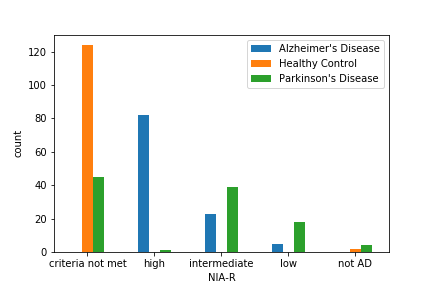
In the figures above, we have found that some of the above features cannot clearly separate out Alzheimer’s and Parkinon’s (sn_depigmentation and NIA-R) or Parkinson’s and Control (Braak score), they did a good job at grossly separating out at least one group. Therefore, we included the above features along with other basic informations in the above table in our model.
Pipeline
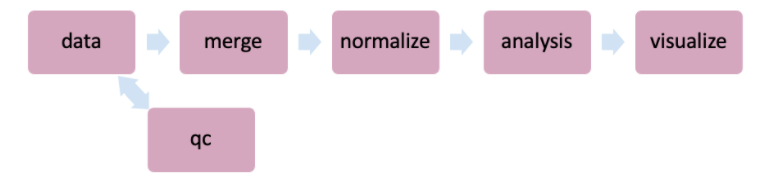
For this project, the basic overview of our pipeline is that we want to access our data, preform necessary quality checks (qc), then merge the inputs into a gene_matrix and feature table, normalize by outputting normalized counts, return the LRT plots in the analysis step, and then finally visualize.
The basic pipeline structure is shown in the figure below:
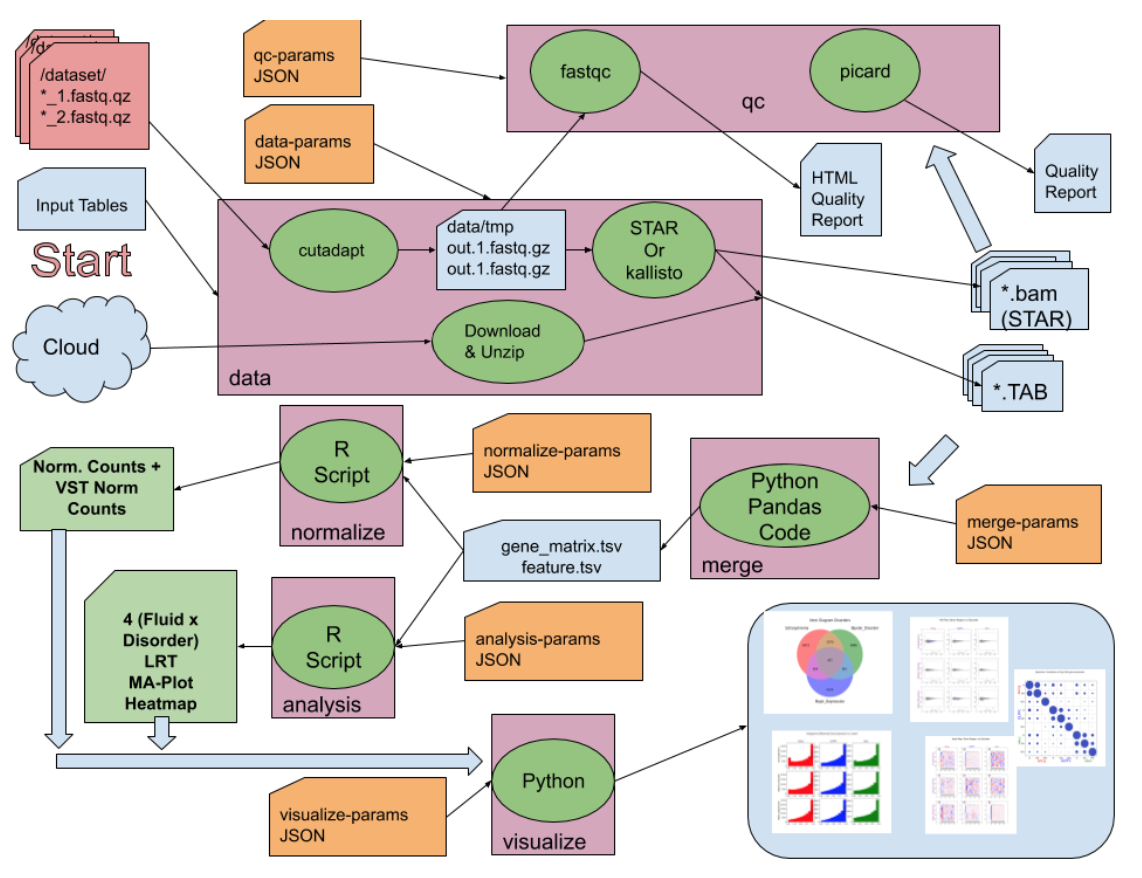
The figure below shows our entire pipeline:
Quality Checks
To clean our raw sequence data, we first use cutadapt to cut out the adapter sequences, which is the noise produced by the sequencing machine. Then we double checked the quality of the sequence after cutadapt using FastQC.
Cutadapt
Cutadapt [15] is a tool that is used by geneticists to perform data cleaning on sequence data. When sequence libraries are prepared, the process adds adapter sequences called "primers" to the actual miRNA sequences. However, those types of sequences are not relevant to our analysis, and can actually negatively affect our data quality and our subsequent results. Therefore, the cutadapt tool removes those sequences, as well as any other low-quality reads so that data is ready for analysis. However, since the data provided to us was not the "raw" data, we could not evaluate the quality of the data itself, nor could we perform any quality control like performing cutadapt. The researchers who provided the data to us most likely already performed quality checks and used a tool like cutadapt in data cleaning.
FastQC
FastQC [16] is a tool that is used in checking the quality of raw sequencing data before performing large-scale analysis. The software tool calculates and outputs quality metrics of each of the sequence reads, which allows us to determine whether to keep a sequence read, to “cut away” the extraneous parts of a sequence (using cutadapt), or to leave out the read altogether. The metrics (shown as graphs and tables) include “Per sequence quality scores”, which indicates the average quality of reads over the sequences of an SRA run, “Sequence length distribution”, the distribution of sequence lengths, and an important factor, “Overrepresented sequences”, which are sequences that are not found to be in the human genome, among other measurements. Specifically for overrepresented sequences, FastQC marks these as “overrepresented” because it cannot find the source of the sequences; however, more often than not, they are adapters that have been “tacked on” during the library preparation of the sequences, and are then caught by FastQC. This is where we would use the cutadapt tool to cut out those unnecessary sections, or just completely leave the reads out of the analysis. In the end, by combining all these factors, our decision to keep or leave out sequence reads follows the ERCC (External RNA Controls Consortium) Quality Control Standards. These standards for our data (which is specifically an exRNA-seq dataset) were drawn up at a Washington, DC conference in November 2015 in order to have a universal set of quality check guidelines [17].
1. An individual RNA-Seq dataset is required to have a minimum of 100,000 reads that overlap (sense or antisense) with any annotated RNA transcript in the host genome. The annotation includes all small RNAs, such as miRNAs (from miRBase), piRNAs, tRNAs, snoRNAs, and circular RNAs, as well as long transcripts from GENCODE, which includes both protein coding genes and long non-coding RNAs (lncRNAs).
2. The fraction of reads that align to the host genome (after filtering out contaminants, adaptor dimers and ribosomal reads) that also align to any annotated RNA transcript (described in point #1) should be greater than 0.5.
Visualizations
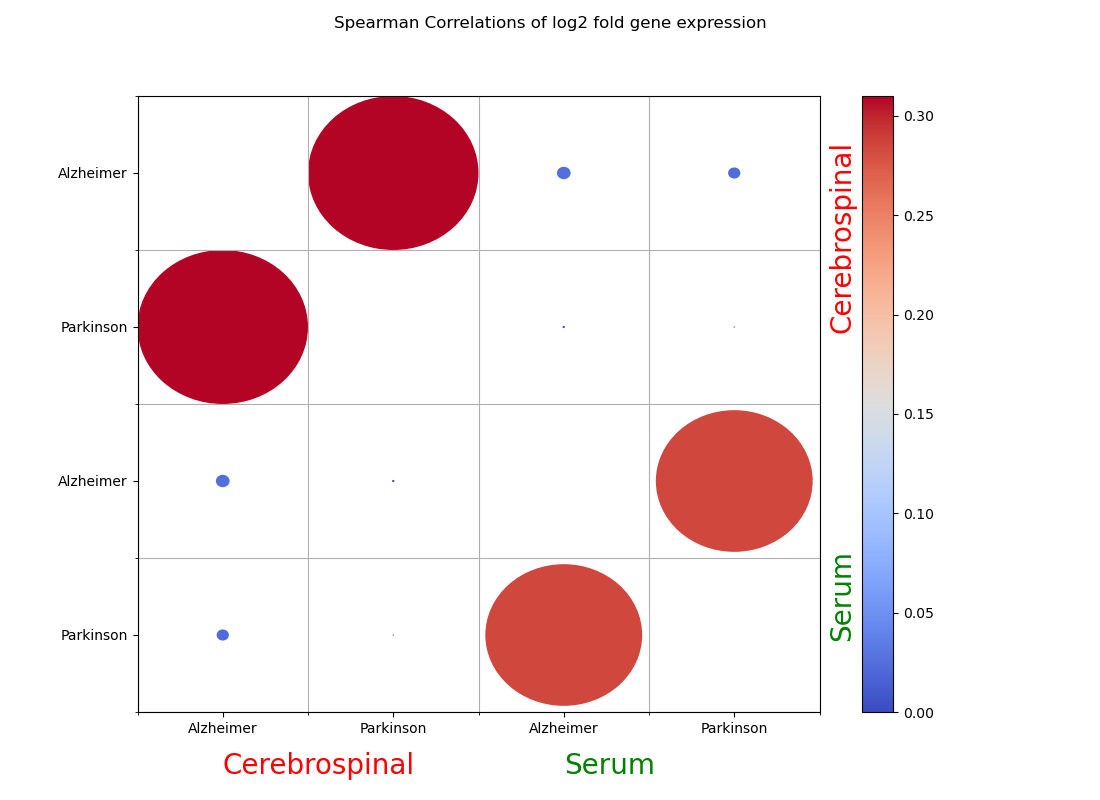
Below is a Spearman correlation plot of the differential expression results of the different disorders compared among themselves for the two biofluid regions (CSF, serum). Differential expression is measured by the value of the log fold change, which is calculated by DESeq2. DESeq2 quantifies the difference in gene expression between the disorder and control group for each comparison. As we can see in the image, the differentially expressed genes are very similar between the two diseases in their respective biofluids, based on the large and heavily red circles in the plot. However, they do not show as much similarity between the two biofluids.
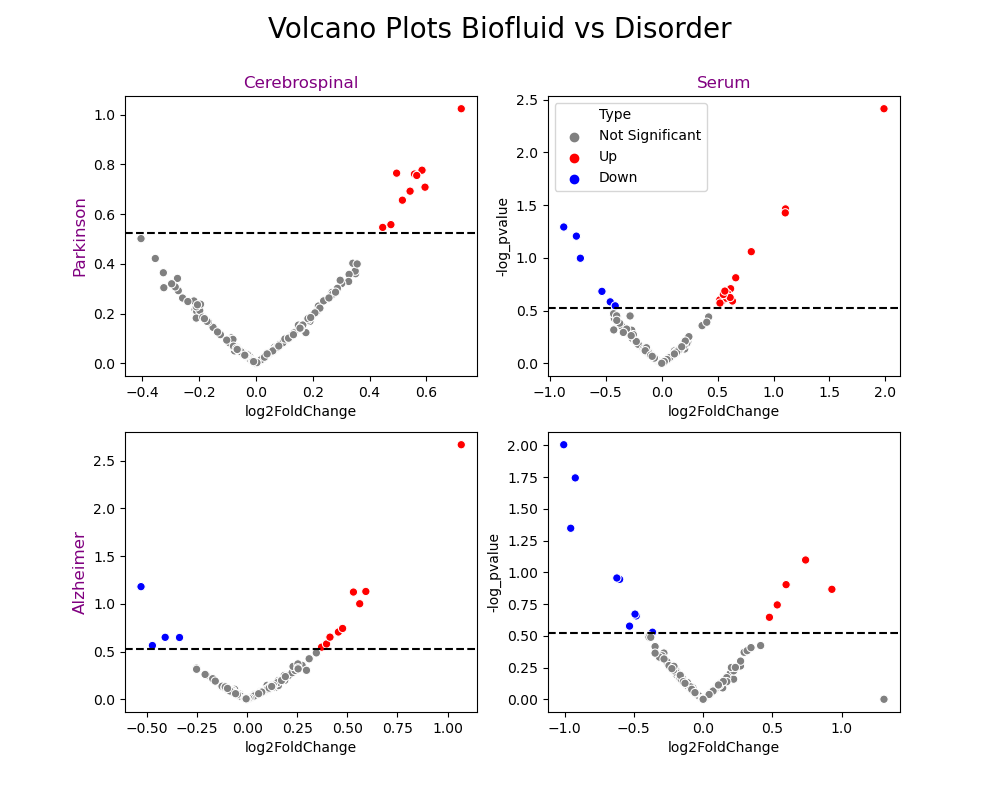
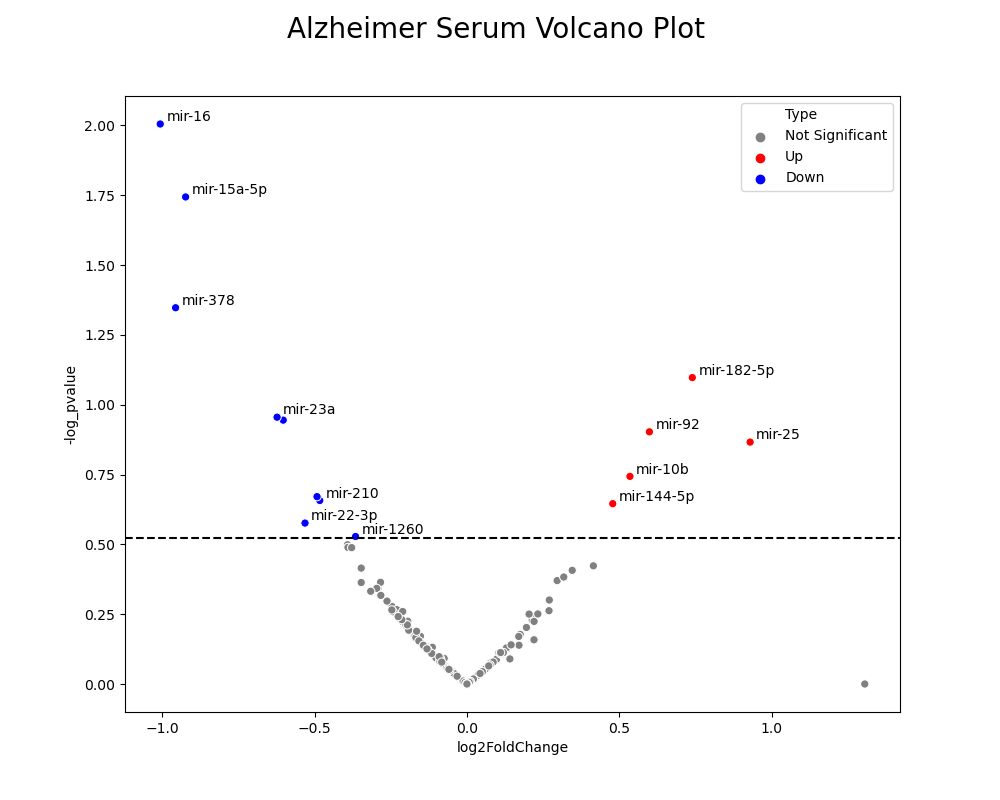
The volcano plots below are plotted for each biofluid and each disease, yielding a 2x2 visualization. The blue points for each plot are the down-regulated miRNA sequences, which means they are produced at lower amounts than the control group (healthy patients). If they are produced at lower amounts, this means that they suppress the expression of mRNA at lower amounts, and the proteins or transcription factors that those mRNA are responsible for encoding are produced at higher amounts. This is opposite for the red points, which are the up-regulated miRNA sequences. They are produced at higher amounts, so they regulate more of the expression of mRNA, and therefore the production of the proteins that those mRNA encode.
The single volcano plot below is a specific look at the volcano plot for Alzheimer’s patients in the serum biofluid. The labels next to the points are the names of the miRNA that are differentially expressed. We then used these names to map the differentially expressed miRNA to the specific target mRNA that they affected the expression of. From there, we inspected the responsibilities of those mRNA and how they are correlated with the development of Parkinson’s or Alzheimer’s
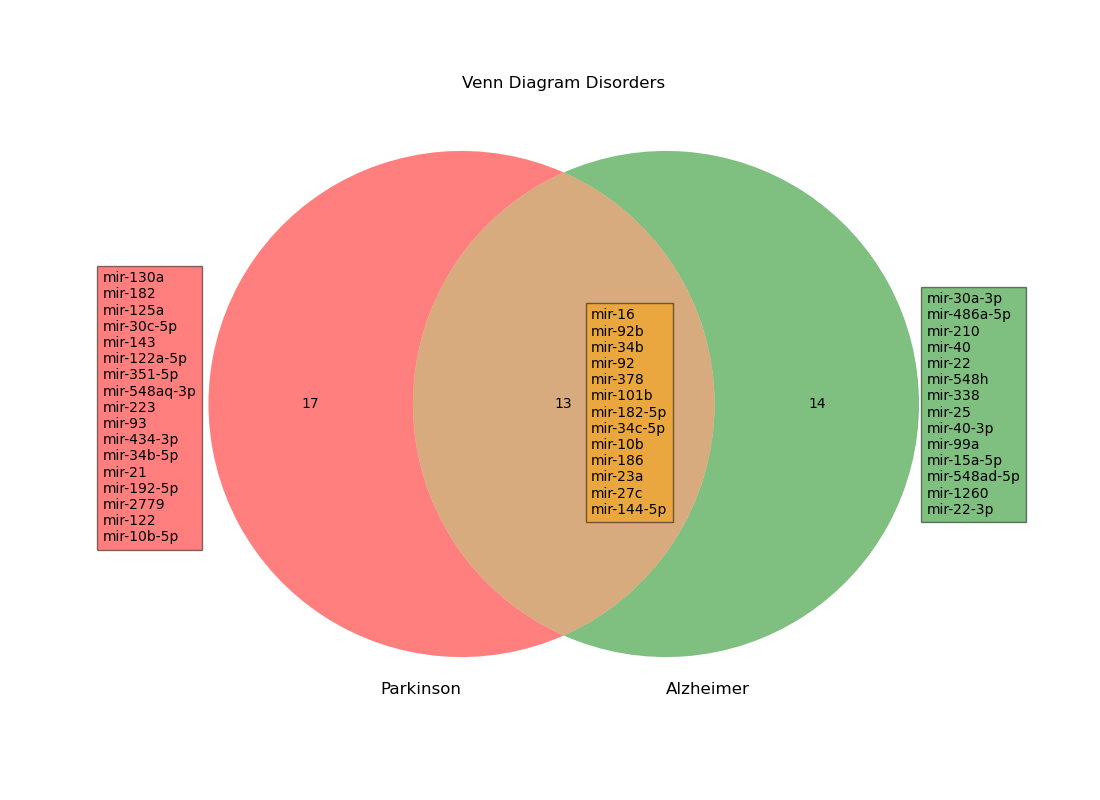
Shown below is the Venn diagram we created that shows the differentially expressed miRNA that were common to both Alzheimer’s and Parkinson’s patients. Finding these overlapping miRNA is one of the core objectives of our project, and can lead to exploration of how these miRNA lead to mental health problems, as well as shared treatments that can target the causes of both Alzheimer’s and Parkinson’s patients.
Results: Mappings
Equipped with the overlapping miRNA in the Venn diagram above, we mapped them to the mRNA that they suppress, and subsequently to the proteins that those mRNA encode. We found that the most relevant and significant proteins that were affected by the overlapping miRNA are pivotal in normal brain function. They are listed below with their responsibilities.
- neurofilament medium
- The neurofilament protein is used by cells to mark neurons that are damaged
- If this system is affected, there would be no way to distinguish between working and damaged neurons, gravely affecting neuronal activity [18]
- neuroplastin
- Neuroplastin is a protein that is important in neuron and synaptic function
- They are significant in the process of cells communicating with each other [19]
- neurocalcin delta
- A decrease in this protein has been shown to protect against spinal muscular atrophy, a symptom related to Parkinson’s
- Has been linked with the neurons in the hippocampus of adults, the part of the brain responsible for memory [20]
- brain derived neurotrophic factor
- BDNF protein is largely responsible for promoting the growth of and dealing with the maintenance of nerve cells [21]
- neuregulin 3
- a group of signaling proteins that helps to oversee cellular functions of neuronal systems, like survival, proliferation, and differentiation of nerve cells [22]
Conclusion
Our goal for this study was to find genetic overlapping in Alzheimer’s and Parkinson’s in order to guide future research with key miRNA that are present in both diseases. We identified 13 up and down-regulated miRNAs in the CSF of Alzheimer’s patients, 10 up and down-regulated miRNAs in the CSF of Parkinson’s patients, 14 up and down-regulated miRNAs in the serum of Alzheimer’s patients, and 22 up and down-regulated miRNAs in the serum of Parkinson’s patients. From those, we identified 13 miRNAs that were shared between the diseases and between the biofluids. We mapped all the up-regulated, down-regulated and overlapping miRNAs to the top 3 target mRNAs that they are binding to (ranked in terms of the mRNA’s (gene’s) “Target Rank” and “Target Score”). As stated, however, these top 3 mRNAs are not necessarily relevant to our studies of brain disorders, so we also identified mRNAs that were tangentially related to neural functions. With careful analysis we discovered that the overlapping miRNA’s were all up-regulated, meaning the miRNAs are restricting the amounts of target proteins that we found to be produced at lower amounts.
We hope that these significant proteins that we found as genetically overlapped in the cerebrospinal and serum biofluid regions will help future researchers and scientists to gain a better understanding at how these two diseases are linked and that future progress can be made in order to target these proteins to inhibit or lessen the effects of both Alzheimer’s and Parkinson’s Diseases.
References
[1] Burgos, Kasandra, et al. “Profiles of Extracellular MiRNA in Cerebrospinal Fluid and Serum from Patients with Alzheimer’s and Parkinson’s Diseases Correlate with Disease Status and Features of Pathology.” PLOS One, vol. 9, no. 5, 5 May 2014, doi:10.1371/journal.pone.0094839.
[2] Charlotte Hewel, et al. “Common MiRNA Patterns of Alzheimer’s Disease and Parkinson’s Disease and Their Putative Impact on Commensal Gut Microbiota.” Frontiers in Neuroscience, 5 Mar. 2019, doi:10.3389/fnins.2019.00113.
[3] Mayo Clinic Staff. “Alzheimer’s Disease.” Mayo Clinic, Mayo Foundation for Medical Education and Research, 29 Dec. 2020, www.mayoclinic.org/diseases-conditions/alzheimers-disease/symptoms-causes/syc-20350447.
[4] Mayo Clinic Staff. “Parkinson’s Disease.” Mayo Clinic, Mayo Foundation for Medical Education and Research, 8 Dec. 2020, www.mayoclinic.org/diseases-conditions/parkinsons-disease/symptoms-causes/syc-20376055.
[5] O’Brien, Jacob, et al. “Overview of MicroRNA Biogenesis, Mechanisms of Actions, and Circulation.” Frontiers in Endocrinology, 3 Aug. 2018, doi:10.3389/fendo.2018.00402.
[6] “Cerebrospinal Fluid (CSF).” National Multiple Sclerosis Society, www.nationalmssociety.org/Symptoms-Diagnosis/Diagnosing-Tools/Cerebrospinal-Fluid-(CSF).
[7] Kopkova, Alena et al. “MicroRNA Isolation and Quantification in Cerebrospinal Fluid: A Comparative Methodical Study.” PLOS One, vol. 13, no. 12, 7 Dec. 2018, doi:10.1371/journal.pone.0208580.
[8] Flournoy, Blake. “What Is Serum?” Sciencing, 21 Jan. 2020, sciencing.com/what-is-serum-4673561.html.
[9] “Analysis of Circulating MiRNA in Plasma or Serum.” 3D-Gene, www.3d-gene.com/en/products/dna/dna_004.html
[10] Smith, Yolanda. “Alzheimer’s Tangles and Plaques: What’s the Difference?” Medical News, 26 Feb. 2019, www.news-medical.net/health/Alzheimers-tangles-and-plaques-whats-the-difference.aspx.
[11] Burke, Robert E, et al. “A Critical Evaluation of The Braak Staging Scheme for Parkinson’s Disease.” Annals of Neurology, vol. 64, no. 5, 1 Nov. 2009, doi:10.1002/ana.21541.
[12] “What Is Lewy Body Dementia?” National Institute on Aging, U.S. Department of Health and Human Services, www.nia.nih.gov/health/what-lewy-body-dementia.
[13] Hack, Nawaz, et al. “Substantia nigra depigmentation and exposure to encephalitis lethargica.” Annals of Neurology, vol. 76, no. 6, 1 Dec. 2013, doi:10.1002/ana.23697.
[14] Bennett, D A, et al. “Neuropathology of older persons without cognitive impairment from two community-based studies”. Neurology, vol. 66, no. 12, 27 Jun 2006, doi: 10.1212/01.wnl.0000219668.47116.e6.
[15] Martin, Marcel. “Cutadapt Removes Adapter Sequences from High-Throughput Sequencing Reads.” EMBnet.journal, journal.embnet.org/index.php/embnetjournal/article/view/200/479.
[16] Babraham Bioinformatics - FastQC A Quality Control Tool for High Throughput Sequence Data, www.bioinformatics.babraham.ac.uk/projects/fastqc/.
[17] “Data Quality Control Standards.” ExRNA Research Portal, exrna.org/resources/data/data-quality-control-standards/.
[18] “NEFM neurofilament medium.” National Center for Biotechnology Information (NCBI), https://www.ncbi.nlm.nih.gov/gene/4741.
[19] Beesley, Philip W, et al. “The Neuroplastin adhesion molecules: key regulators of neuronal plasticity and synaptic function”. Journal of Neurochemistry, vol. 131, no. 3, 14 Aug. 2014, doi: 10.1111/jnc.12816.
[20] Upadhyay, Aaradhita, et al. “Neurocalcin Delta Knockout Impairs Adult Neurogenesis Whereas Half Reduction Is Not Pathological”. Frontiers in Molecular Neuroscience, vol. 12, no. 19, 12 Feb. 2019, doi: 10.3389/fnmol.2019.00019.
[21] “BDNF gene.” MedlinePlus, https://medlineplus.gov/genetics/gene/bdnf/
[22] Seroogy, Kim B, et al. “Neuregulins”. Handbook of Biologically Active Peptides (Second Edition), 2013.